
Nagios4 : A trip down on memory lane
A brief story
When I joined the first ever company I worked for, we were doing a migration from nagios to icinga2. I did not read up more about it at the moment, I did not know anything at all (fresh out of college), and all I wanted was to get up to speed. Have been working for almost 9 years now and after using icinga2 to quite some time, and then not using it at all when prometheus and alertmanager came along.
When it came to using some monitoring/alerting for my home lab setup, I went with prometheus but never really cared to setup alertmanager. I had dashboard that would show me the state of things, but I would only know things were down when I tried to access them. It was not an issue as the things that I used often, would be more reliable than things that I used sparingly. Then I moved to a different country. And I had a multiple remote setups. One of my most promising one was hosting a mail server on my raspberry pi in my native place which required quite a bit of effort keeping up partly due to lack of my physical presence, and partly as the ISP would change things and not inform me, leading to mails not reaching the pi.
Recently, I have decided to work towards standardizing the setup. And i wanted to check the state of nagios / icinga2 and see if it would be less effort to setup. Reading up it seems that nagios fit the bill for me due to the limited size of the setup. And that leads me to have my first instance of selfhosted nagios4.
Simple tutorial to install nagios4
We shall start with what you require to set it up
Requirements
- Debian Linux Computer
- 1 CPU 1GB RAM 32 GB storage (mine is a LXC on proxmox)
- I think the resources required would be proportional to number of systems that you want to monitor, but you may start small as current systems are pretty capable.
- Familiarity with linux.
Installation
The nagios4 packages are well supported in debian packages and I did not want to install from source as the nagios docs at https://support.nagios.com/kb/article.php?id=96#Debian suggest.
sudo apt-get update
sudo apt-get install nagios4

# The next steps are required to allow specific things to work
sudo a2enmod cgi
sudo a2enmod rewrite
sudo systemctl restart apache2
The above should allow you to get a basic version of nagios running and it would allow you to show the checks etc, but it will not allow you to make changes to nagios from the UI.
You should be able to see the dashboard on: http://<ip>/nagios4
Click on Services in the side panel to see:
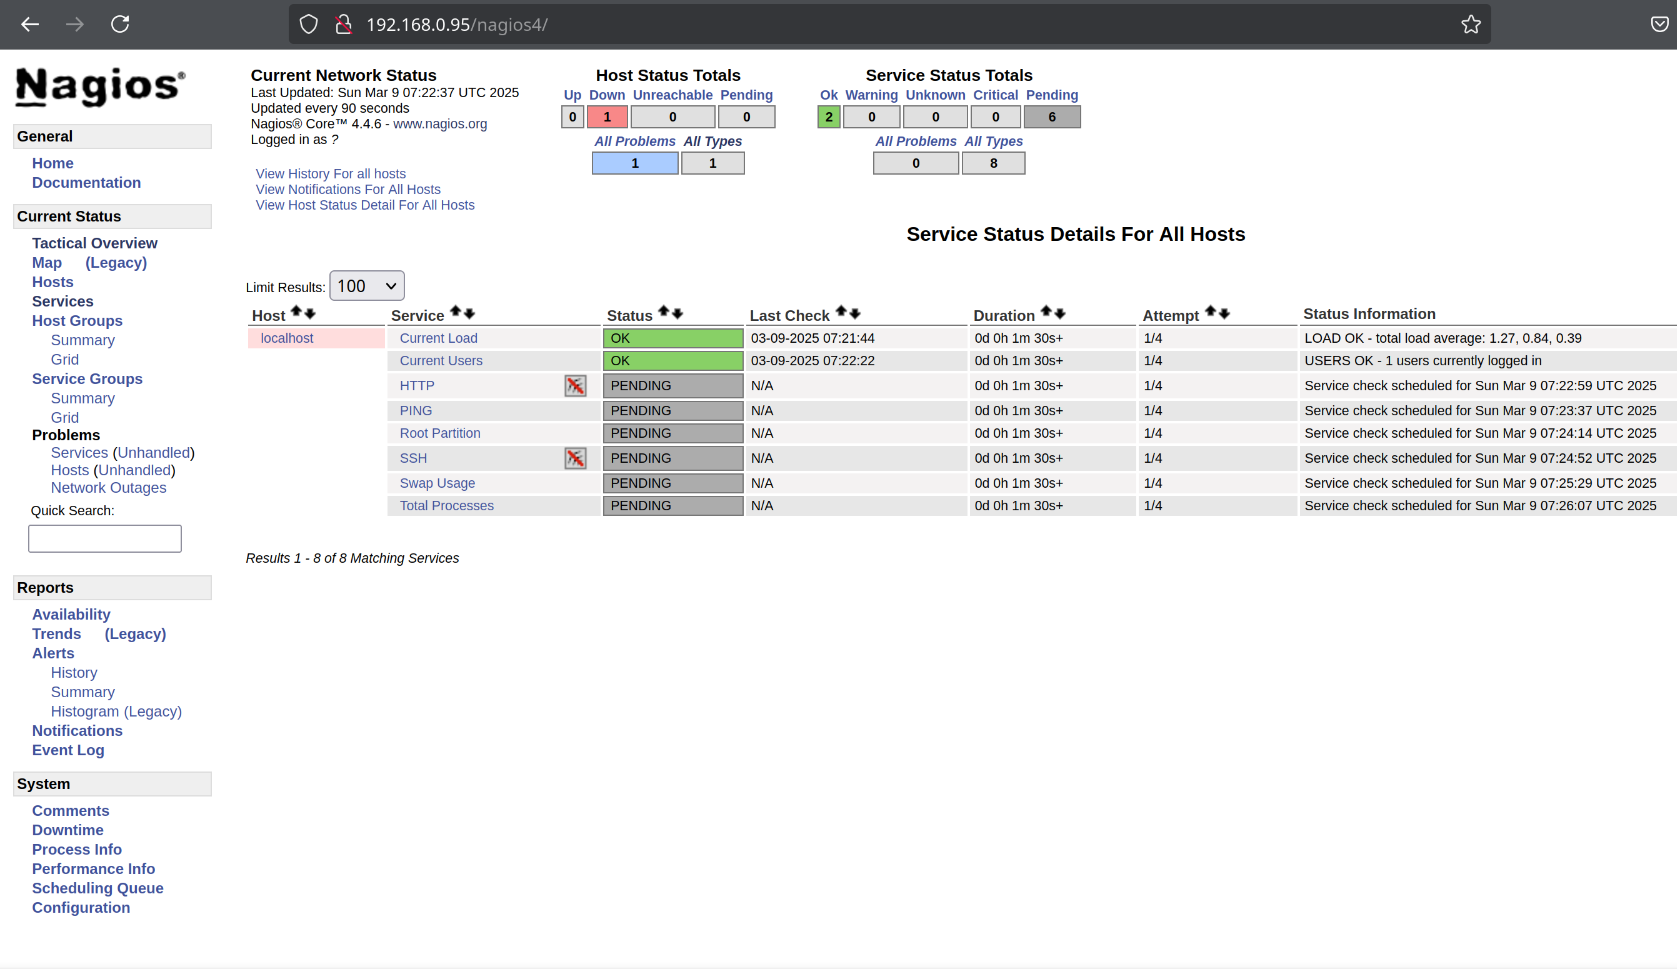
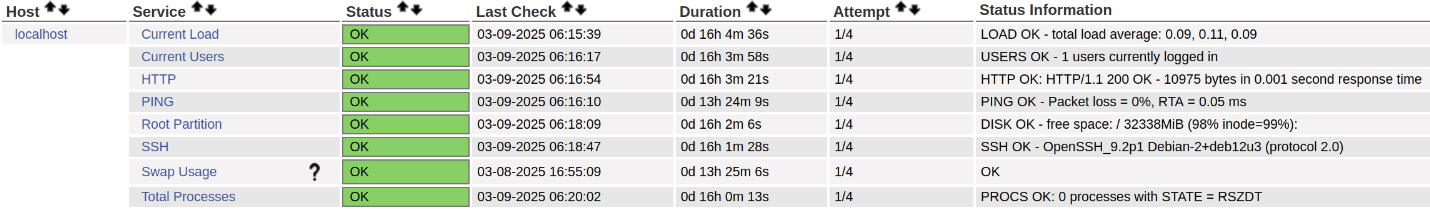
Above images shows that nagios just started and has not run all the checks for localhost. Waiting for a few minutes gives us:
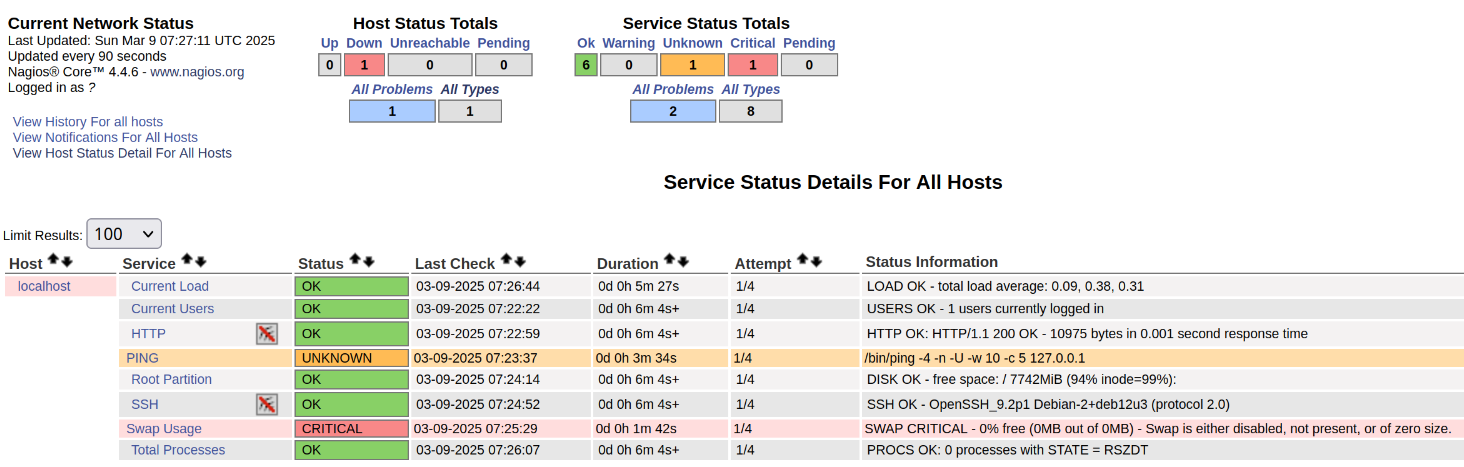
Here, we can see that we need to fix a few problems on this dashboard.
locahostis showing as down- PING check is on unknown state
- Swap Usage is CRITICAL
- HTTP and SSH checks are set to not notify
1 and 2 are related. Host is marked as down as PING check is not passing.
As this is nagios, we should be able to debug the checks by running the check commands manually on the server.
Lets check why ping is failing. The command nagios is running is:
/bin/ping -4 -n -U -w 10 -c 5 127.0.0.1
root@nagios:~# /bin/ping -4 -n -U -w 10 -c 5 127.0.0.1
PING 127.0.0.1 (127.0.0.1) 56(84) bytes of data.
64 bytes from 127.0.0.1: icmp_seq=1 ttl=64 time=0.028 ms
64 bytes from 127.0.0.1: icmp_seq=2 ttl=64 time=0.047 ms
64 bytes from 127.0.0.1: icmp_seq=3 ttl=64 time=0.071 ms
64 bytes from 127.0.0.1: icmp_seq=4 ttl=64 time=0.050 ms
64 bytes from 127.0.0.1: icmp_seq=5 ttl=64 time=0.034 ms

--- 127.0.0.1 ping statistics ---
5 packets transmitted, 5 received, 0% packet loss, time 4108ms
rtt min/avg/max/mdev = 0.028/0.046/0.071/0.014 ms
That seems to be working, why does the check fail then?
Nagios runs checks using the nagios user. Lets try the same command as nagios user:
root@nagios:~# sudo -u nagios /bin/ping -4 -n -U -w 10 -c 5 127.0.0.1
/bin/ping: socktype: SOCK_RAW
/bin/ping: socket: Operation not permitted
/bin/ping: => missing cap_net_raw+p capability or setuid?
It is clear why the check fails now, the lxc image does not have ping with setuid bit set on ping binary which prevents non root users from using root privileges that the binary uses to send raw packets. There is an easy fix
root@ntest:~# setcap cap_net_raw+ep /bin/ping
root@ntest:~# sudo -u nagios /bin/ping -4 -n -U -w 10 -c 5 127.0.0.1
PING 127.0.0.1 (127.0.0.1) 56(84) bytes of data.
64 bytes from 127.0.0.1: icmp_seq=1 ttl=64 time=0.029 ms
64 bytes from 127.0.0.1: icmp_seq=2 ttl=64 time=0.068 ms
64 bytes from 127.0.0.1: icmp_seq=3 ttl=64 time=0.072 ms
64 bytes from 127.0.0.1: icmp_seq=4 ttl=64 time=0.082 ms
64 bytes from 127.0.0.1: icmp_seq=5 ttl=64 time=0.058 ms
--- 127.0.0.1 ping statistics ---
5 packets transmitted, 5 received, 0% packet loss, time 4116ms
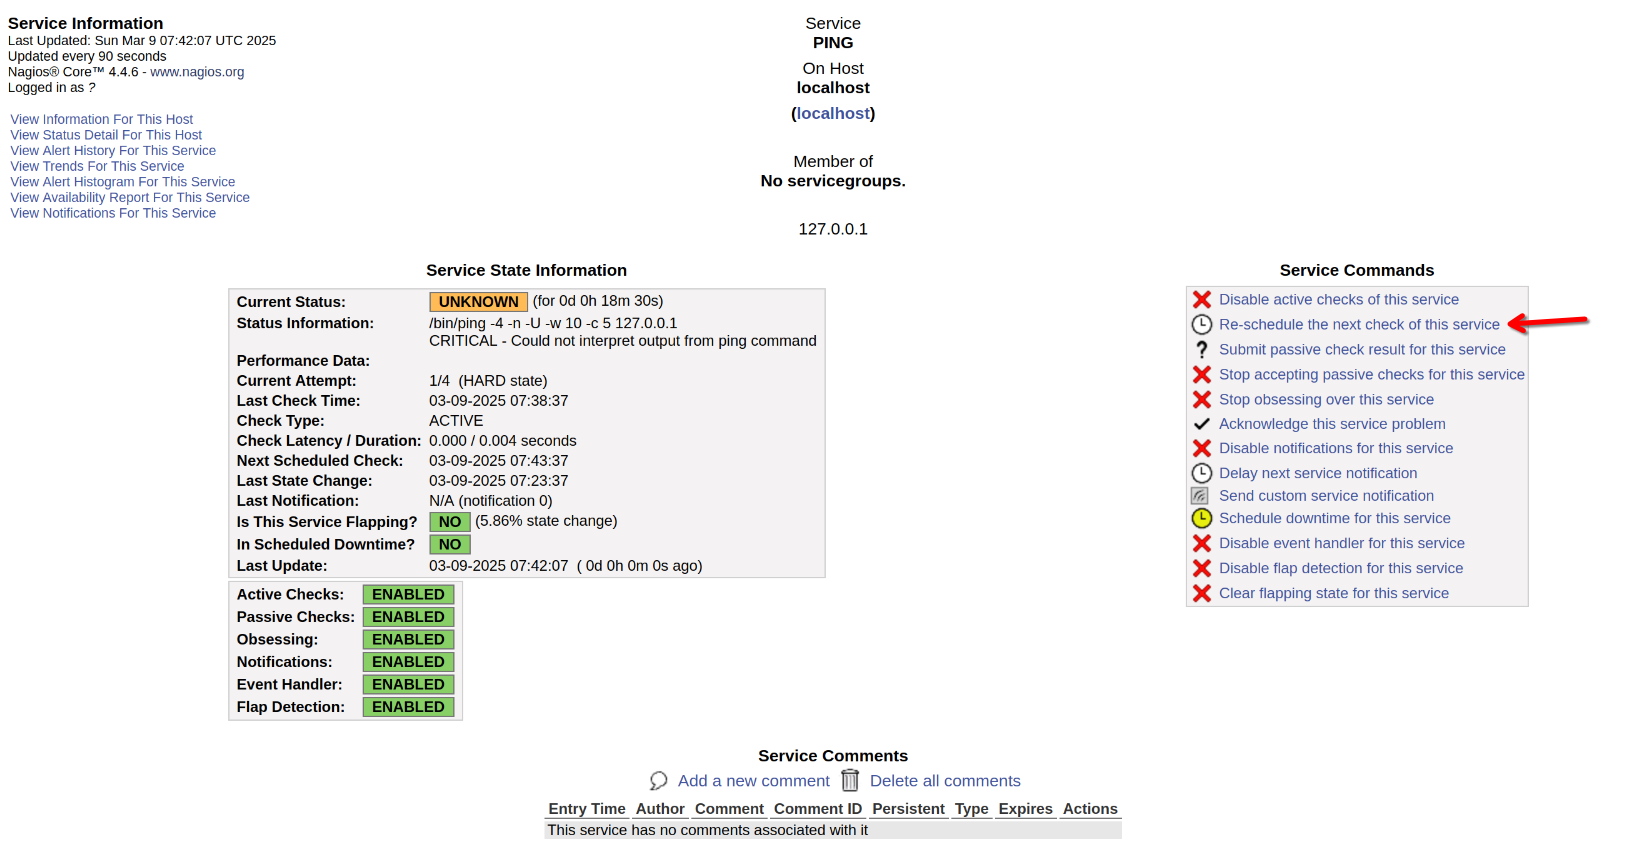
rtt min/avg/max/mdev = 0.029/0.061/0.082/0.018 msIf we are a bit impatient to get the alert to clear, we can re-schedule the check by clicking the appropriate link on the UI
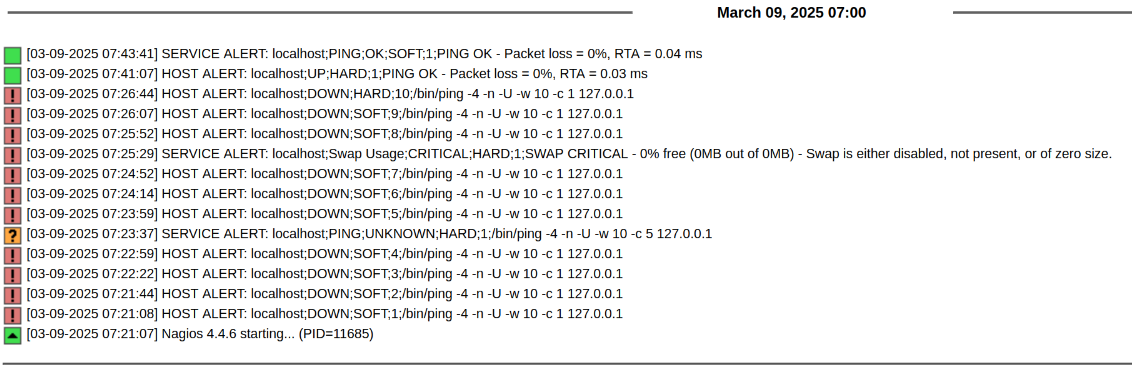
We can see the alert history for the service by clicking on the appropriate link and we get the following which shows that the alert recovered
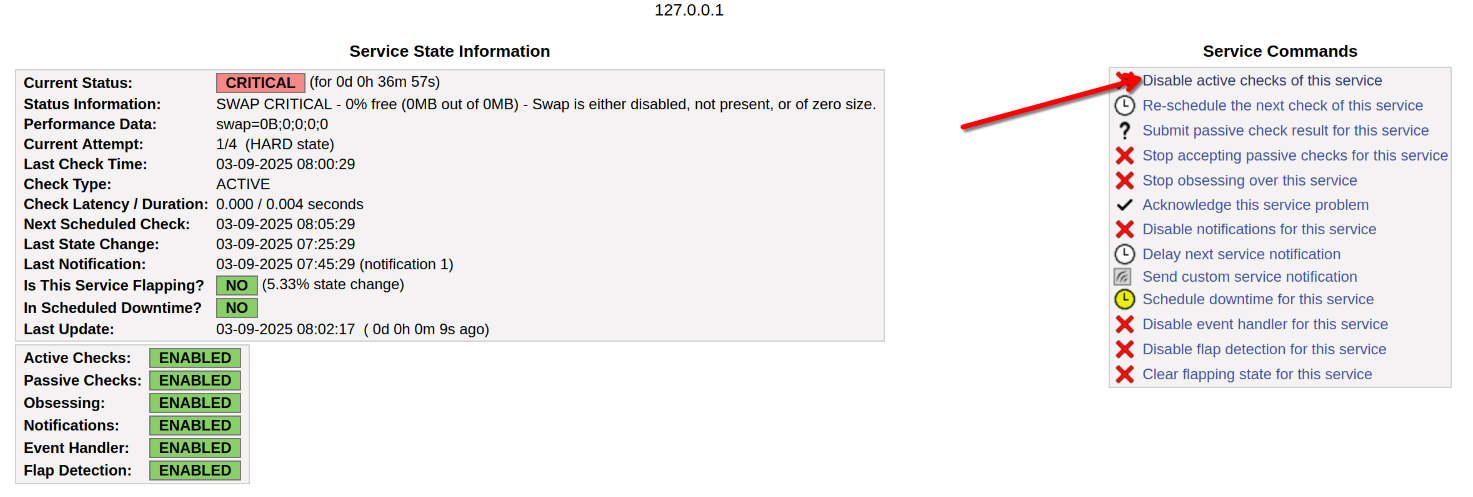
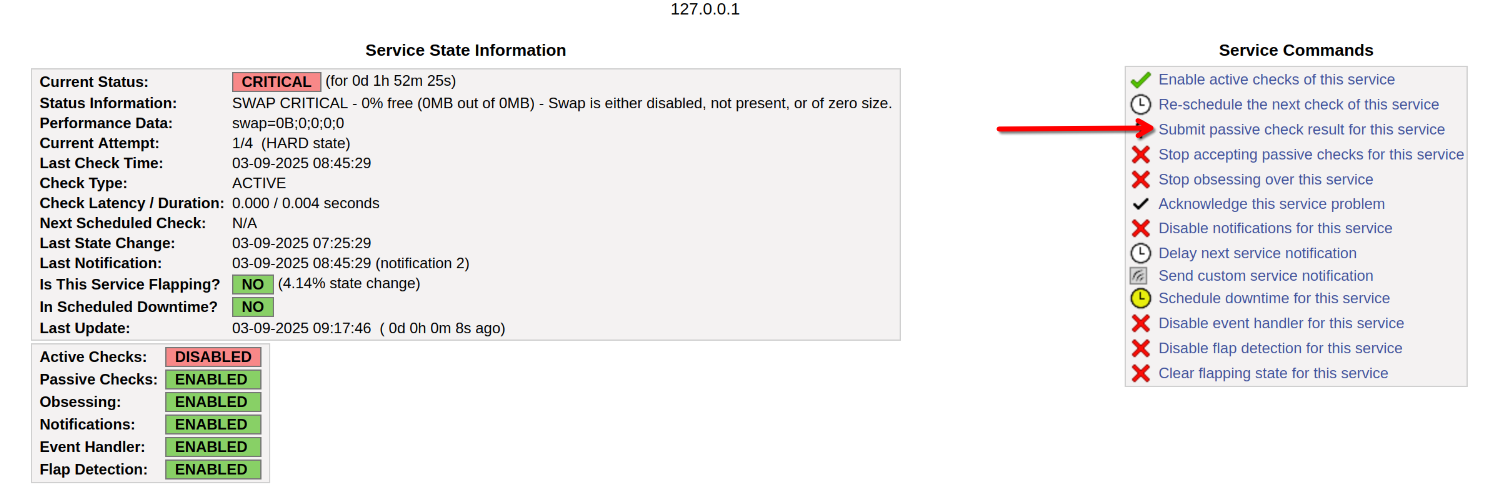
Lets move on to the swap alert. I do not want to track swap as I have purposefully disabled swap on my server. So. I would want to disable the check and then add a manual OK state. (The better way will be to remove the check using the configs, but I am being lazy).
When I try doing so, nagios is being cautious and not allowing me to proceed.

My setup is supposed to be internal only and I plan to add auth in future (in addition to the IP whitelist that exists in proxmox).
So I shall be disabling the checks and balances that nagios has which is blocking me from making changes from the UI as I am not authenticated with the proper user.
- Remove the checks in the nagios config file
# BEFORE
root@nagios:~# cat /etc/nagios4/cgi.cfg | grep -P '(use_authentication|default_user_name)'
use_authentication=0
# default_user_name=guest
root@nagios:~# vi /etc/nagios4/cgi.cfg
# AFTER
root@nagios:~# cat /etc/nagios4/cgi.cfg | grep -P '(use_authentication|default_user_name)'
use_authentication=1
default_user_name=nagiosadmin
This allows us to make the above changes without any issues.
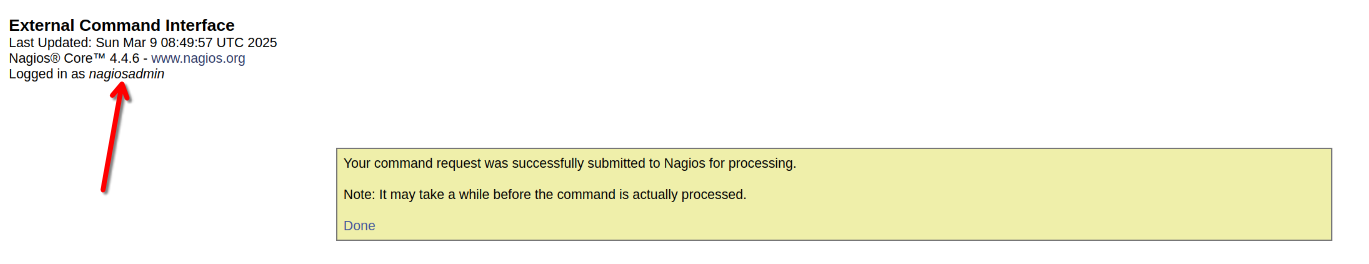
Also note the user we now show logged in as nagiosadmin.
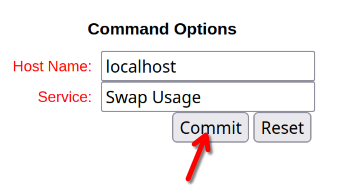
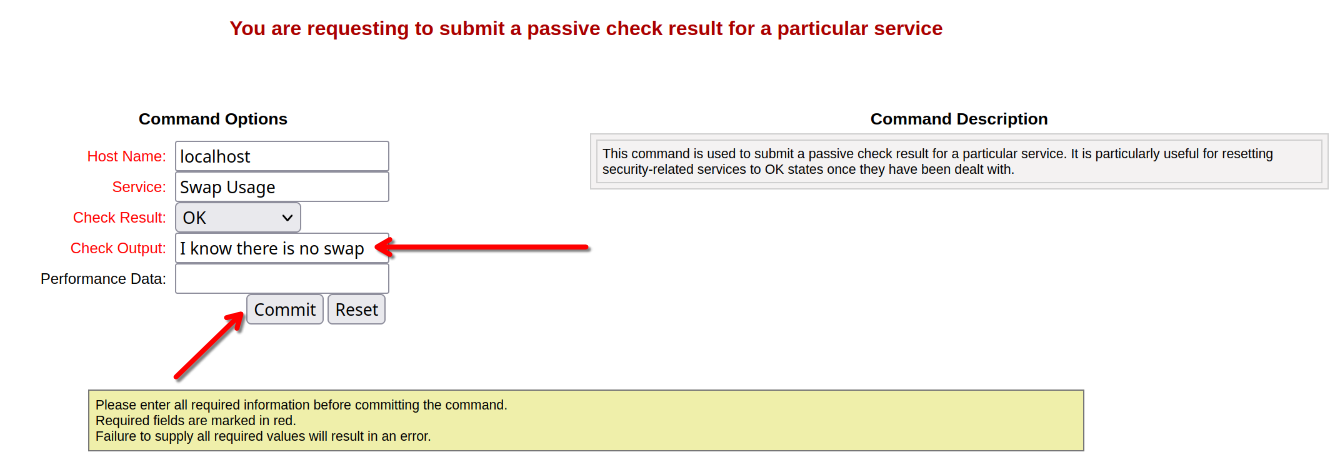
We can add a passive check result and make the alerts show green now
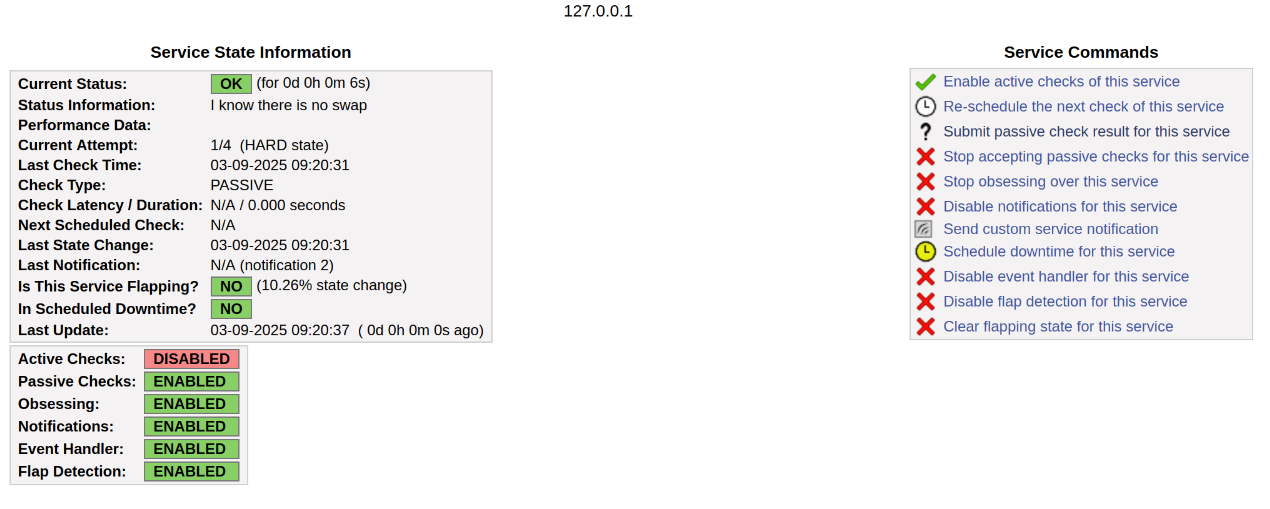
That cleans up my dashboard, but my Tactical Overview view still says that there are two more things to look for
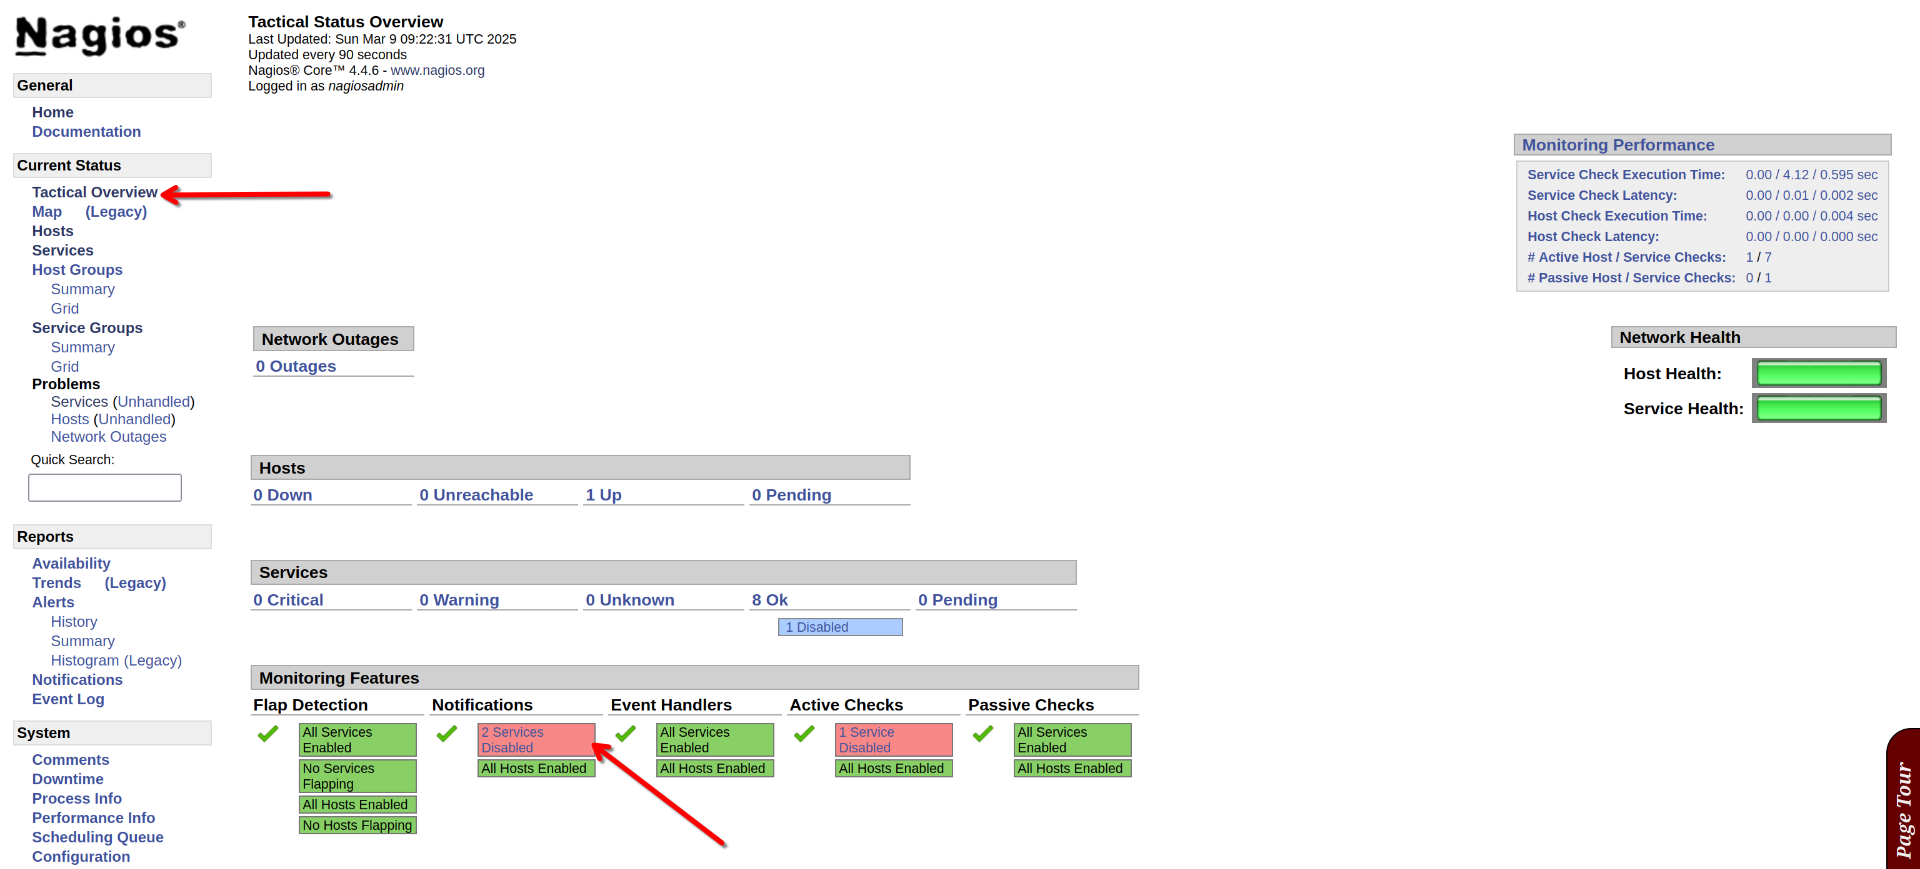
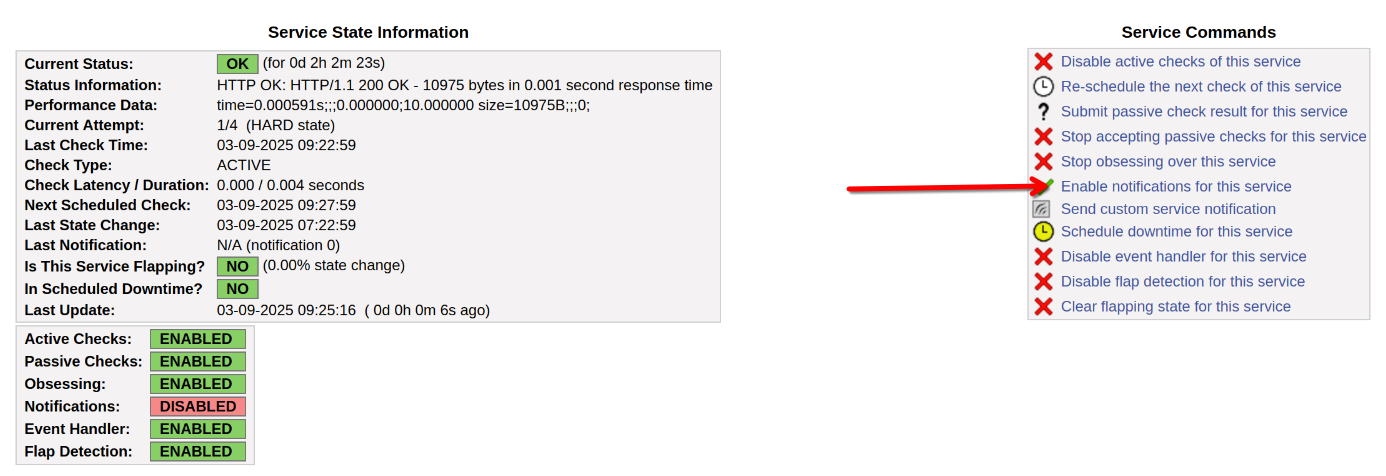
We can enable notifications by just clicking the appropriate link in the check.
To see the services affected, we click in the 2 Services Disabled link

And that gets the initial setup of nagios4 complete. Adding new hosts/checks might be covered in a new article - once I get around to doing so.